Gantt chart
Project schedules can be analyzed and
issues can be identified immediately.
issues can be identified immediately.
If project schedules are simply listed up, individual schedules, the extent of
delays in schedules and workflow could be missed in some cases.
Clovine enables you to check works from various perspectives while
managing schedules easily and conveniently through effective analysis tools.
delays in schedules and workflow could be missed in some cases.
Clovine enables you to check works from various perspectives while
managing schedules easily and conveniently through effective analysis tools.
Project schedules can be
analyzed and issues can be identified immediately.
analyzed and issues can be identified immediately.
If project schedules are simply listed up,
individual schedules, the extent of delays
in schedules and workflow could be missed
in some cases. Clovine enables you to check
works from various perspectives while managing
schedules easily and conveniently through
effective analysis tools.
individual schedules, the extent of delays
in schedules and workflow could be missed
in some cases. Clovine enables you to check
works from various perspectives while managing
schedules easily and conveniently through
effective analysis tools.
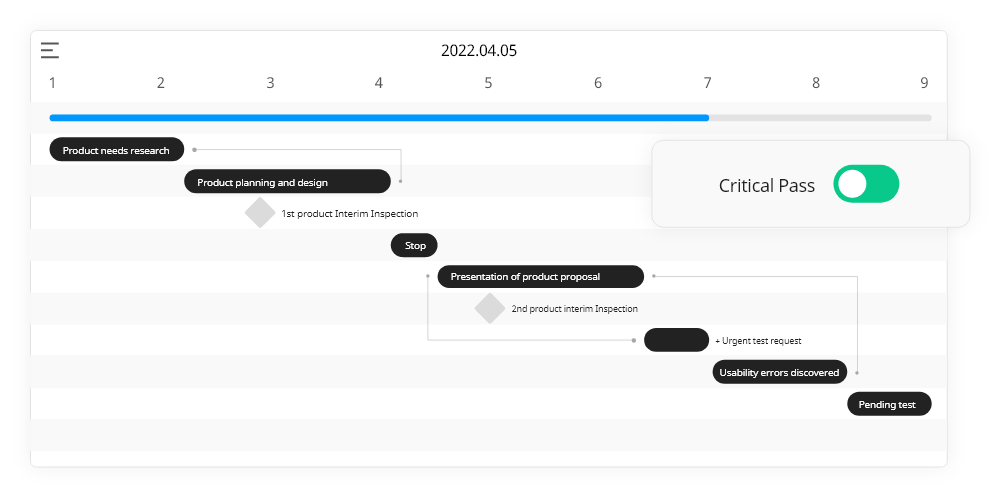
#Predict schedule delays, Critical Pass
Offer easy and quick analysis tools
Delays in tasks can be predicted just by activating the critical pass button
and risks following such can be prevented.
and risks following such can be prevented.
View more →
#Predict schedule delays, Critical Pass
Offer easy and quick
analysis tools
Delays in tasks can be predicted just by activating
the critical pass button and risks following such
can be prevented.
the critical pass button and risks following such
can be prevented.
View more →
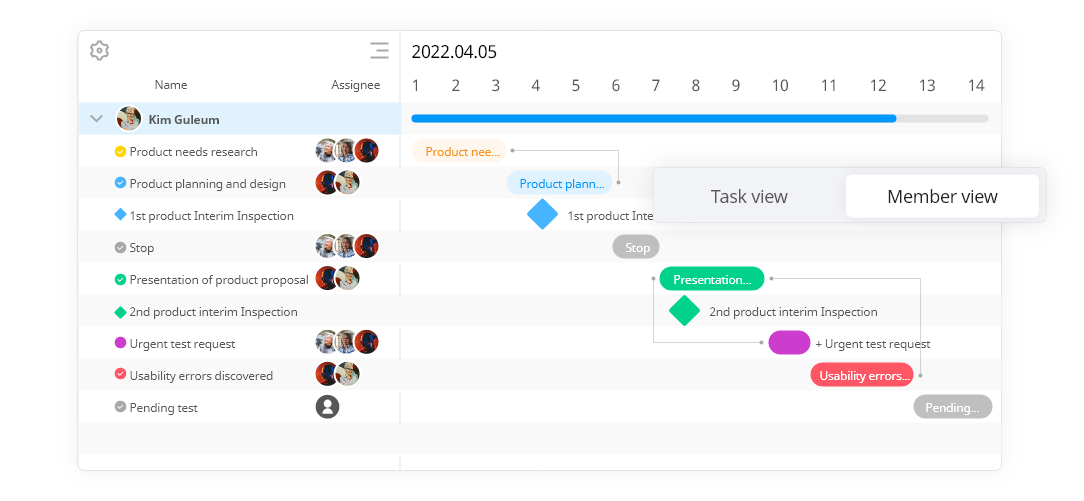
#View the project from various angles
Project View, Member View
By choosing 2 types of Gantt Chart, either based on Project Task or participant,
a more outstanding insight is offered for project management.
a more outstanding insight is offered for project management.
View more →
#View the project from various angles
Project View, Member View
By choosing 2 types of Gantt Chart,
either based on Project Task or participant,
a more outstanding insight is offered for project
management.
either based on Project Task or participant,
a more outstanding insight is offered for project
management.
View more →
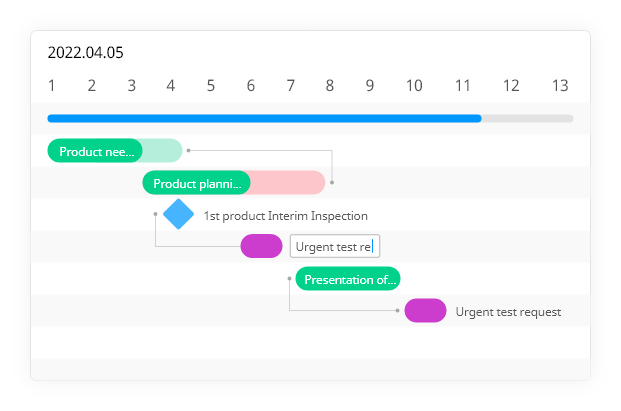
#Monitor schedule changes
Display Reduced time,
Delay, Addition, Relation
In the event, the project finishes earlier or later than
the planned scheduled and if an unexpected schedule is added,
they are displayed clearly. Analyze the progress of the project
using an intuitive Gantt Chart.
the planned scheduled and if an unexpected schedule is added,
they are displayed clearly. Analyze the progress of the project
using an intuitive Gantt Chart.
View more →
#Monitor schedule changes
Display Reduced time,
Delay, Addition, Relation
In the event, the project finishes earlier or later
than the planned scheduled and if an
unexpected schedule is added, they are
displayed clearly. Analyze the
progress of the project using an intuitive Gantt Chart.
than the planned scheduled and if an
unexpected schedule is added, they are
displayed clearly. Analyze the
progress of the project using an intuitive Gantt Chart.
View more →